
Explore the outcome map
See how two values and your thresholds affect the next step.
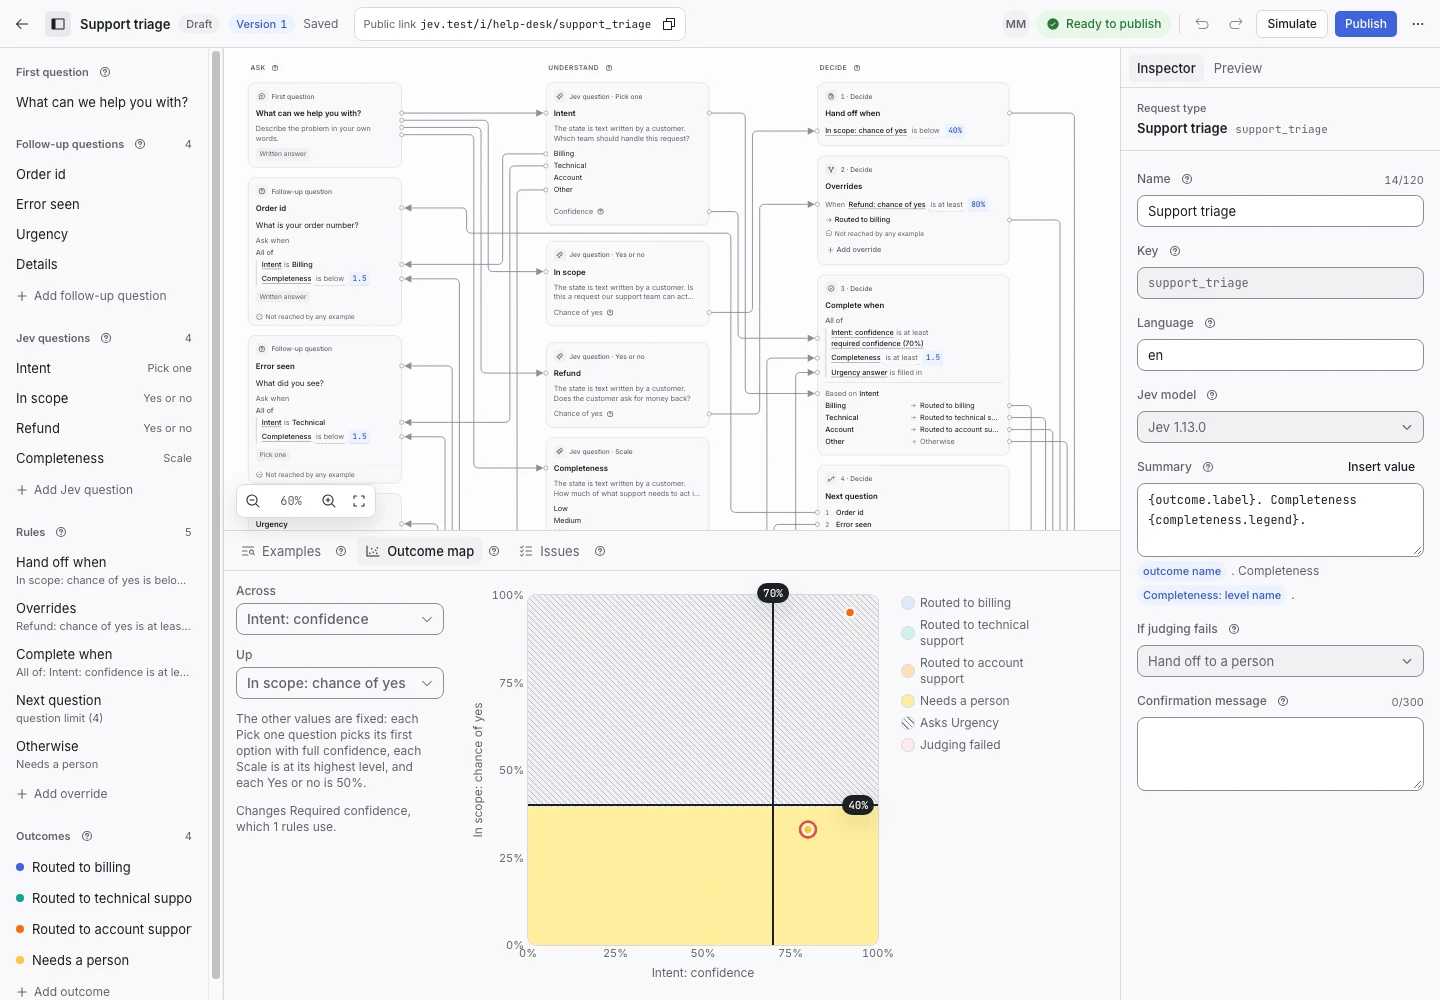
Product screen with sample data. Intake is the previous working name.
Open the map
- Open a request type in the editor.
- Select Outcome map.
- Choose the value for the horizontal axis.
- Choose the value for the vertical axis.
The map shows what the rules would decide for combinations of those values. Its regions can represent an outcome, a handoff, or a follow-up question.
Read the example dots
Example dots locate saved examples on the selected axes. Select a dot to inspect the sample and its decision path.
The map varies only two values. Other values come from the selected example or the fixed baseline. Check that baseline before you interpret the regions.
Move a threshold
- Find the threshold line you want to test.
- Drag it to a new value.
- Watch the region boundaries change.
- Check which examples now match or miss.
- Inspect any changed outcome.
A threshold change updates the draft. It does not change a published version.
Know the limit of the map
A region shows what the rules decide under the displayed inputs. It does not measure the model’s accuracy or predict how often a real request will land there.
Use the map to find boundaries. Use examples and replay to test complete requests.
Publish the change
Open the publish review and read the example impact. Confirm the model and rule changes before you publish a new version.